

The Organization for Economic Cooperation and Development (OECD) released a report comparing policies in its 38 member countries. The OECD is a group of generally high-income democracies, many of which are in Europe.
Here are seven charts from the report that compare the countries on government spending and debt. The charts include all levels of government—federal, state, and local. A legend for the country codes is here.
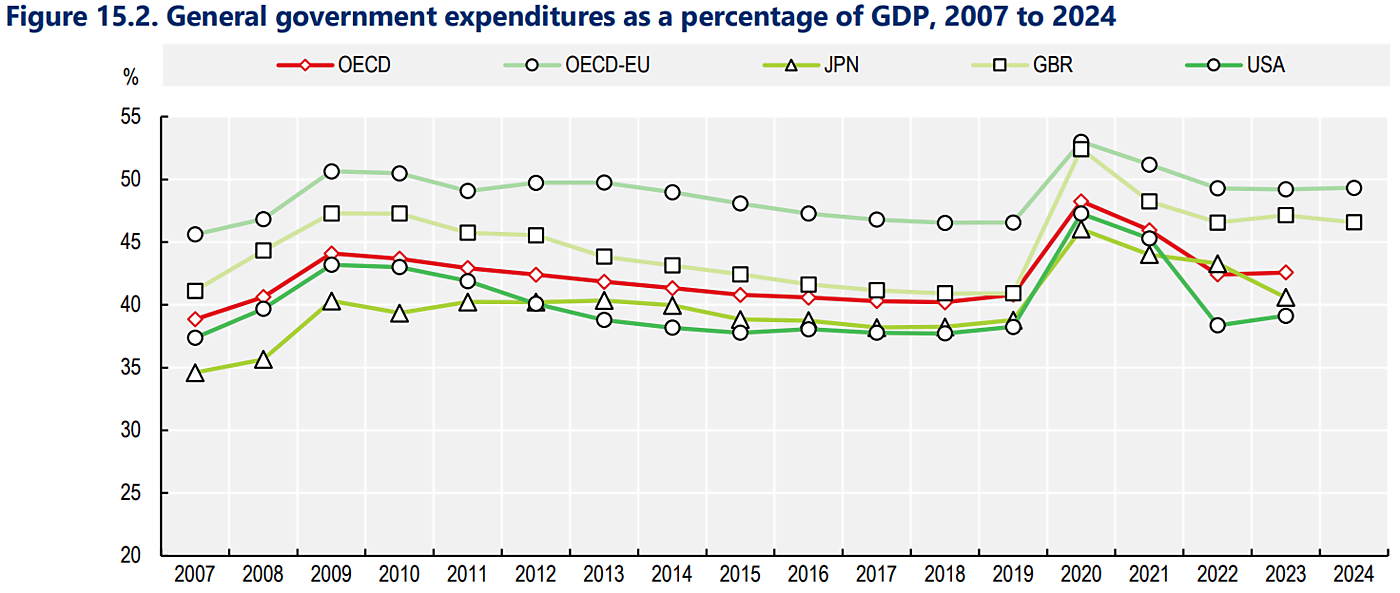
Charts 15.1 and 15.2 show government spending as a percentage of gross domestic product (GDP). US spending of 39 percent compares to the OECD average of 43 percent. America’s relatively smaller government is one reason why it has a higher average income than most countries.

Charts 15.7 and 15.8 show government budget deficits. The US had the highest in 2023 at 7.6 percent of GDP, compared to the OECD average of 4.6 percent. Our high deficit is particularly remarkable because the figures include state and local governments, which in the US generally balance their budgets.
The US budget deficit has been higher than the OECD average every year since at least 2007. Politicians in many countries are fiscally irresponsible, but US politicians appear to be more irresponsible than most.
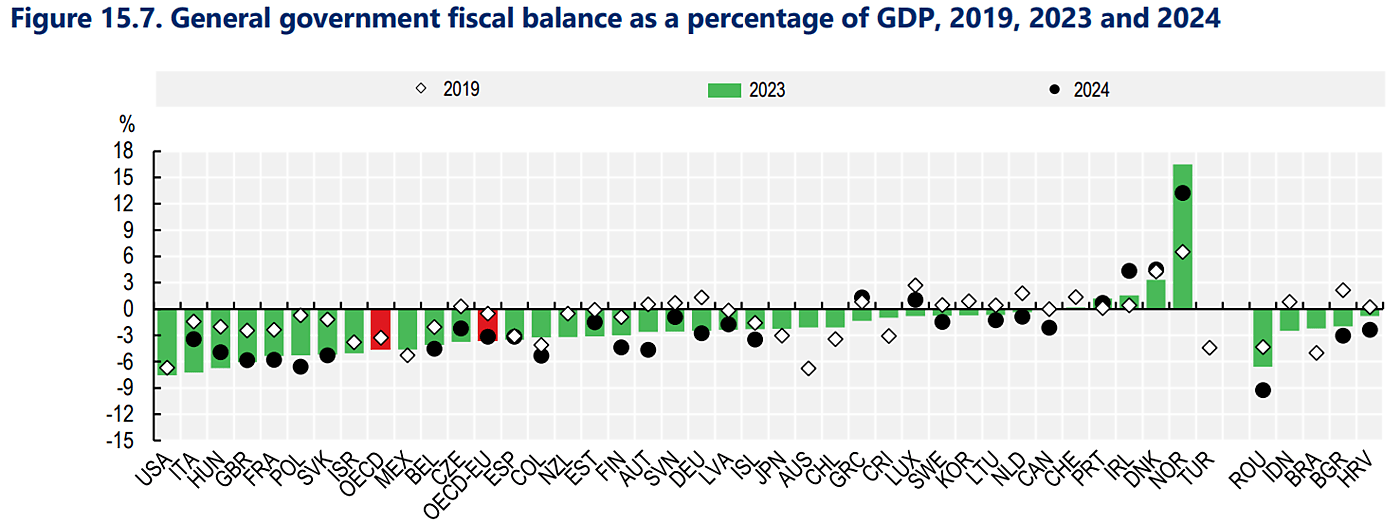

Chart 16.8 shows spending by level of government. In 2023, the federal (central) government accounted for 54 percent of total government spending in the US, compared to the OECD average of 44 percent. Despite the federal structure of the US Constitution, Congress has amassed enormous centralized spending power.
We would have a more efficient and responsible government with less political strife if we decentralized spending. We should cut federal spending from 54 percent of the total to perhaps the Canadian level of 27 percent or the Swiss level of 16 percent. (Switzerland is “CHE”).
Looking at Chart 16.8 another way, 46 percent of US spending is state-local, which compares to 58 percent in Switzerland and 66 percent in Canada.

Chart 16.9 shows government debt. The US had the fourth-highest debt in 2023 at 121 percent of GDP, which compared to the OECD average of 111 percent. Only politicians in Japan, Greece, and Italy have been more fiscally irresponsible than US politicians.
Chart 16.10 shows that governments have become more indebted in recent years. Average OECD debt increased from 72 percent of GDP in 2007 to 110 percent in 2023. Debt is currently down a bit from COVID-19 levels, but global government debt is expected to head back up again in the coming years.
Will rising debt trigger a global financial crisis? Let’s not wait to see. Let’s make “America First” in fiscal responsibility, not America first on budget deficits and fiscal disorder.

