
Norbert Michel, Jai Kedia, and Jerome Famularo

Amid new reports of shrinking manufacturing activity and employment, the Trump administration is struggling more than ever to justify its economic policies. Those policies, restricting trade and immigration, now coincide with fewer Americans working in manufacturing than at any point since the end of the COVID-19 pandemic.
This outcome would be bad for any administration, but it’s particularly problematic for one that’s promised a manufacturing boom with policies that restrict trade and immigration. As Cato scholars (and many others) have repeatedly pointed out, the share of manufacturing employment in the United States has been declining since at least the 1940s due to higher productivity. So, promising a manufacturing job revival might not have been the best idea.
Regardless, a new Wall Street Journal article points to another reason that making this sort of promise was likely a bad idea: Politics based on a false economic narrative.
The article notes that the gradual slowdown in manufacturing is “in some ways” part of “decades-long trends” that “helped empty out Midwestern cities.” This so-called hollowing out of the Midwest is, of course, a very popular explanation for Donald Trump’s rise to political power. Supposedly, manufacturing “boomed from the 1940s up through the 1970s,” and then the bottom fell out because a blind adherence to free market ideology, including free trade, decimated US manufacturing. It destroyed all the “good” jobs, and “hollowed out” the middle class.
There’s a great deal wrong with that story, but is it true that those long-term trends helped empty out Midwestern cities? Is it even true that Midwestern cities “emptied out” after the 1970s? Many people uncritically accept—and repeat—this story, but a closer look at the data reveals they should not accept it so readily.
Evidence Disputes the “Emptied Out” Narrative
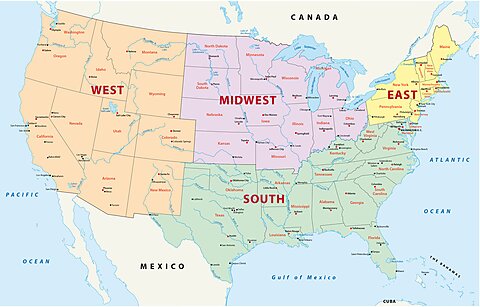
Census data show that 959 counties (out of more than 3,100) across the US experienced population declines from 1970 to 2024. Using the official definition of the Midwest, 504 of these counties—over 50 percent—are from the Midwest. (The US census officially categorizes the Midwest as a collection of the following states: Illinois, Indiana, Iowa, Kansas, Michigan, Minnesota, Missouri, Nebraska, North Dakota, Ohio, South Dakota, and Wisconsin.)
On the surface, this finding seems to support the hollowing-out story. But it isn’t enough to simply state that counties in the Midwest suffered population decline between 1970 and 2024. Rather, the data need to show that this decline was specifically due to US policy changes in the 1970s. After all, there are several reasons for interstate population migration that have nothing to do with defunct factories. Climate preferences, new economic opportunities, a better tax environment, a lower cost of living, or culture could just as likely lead to voluntary and beneficial population migration.
The key question, then, is whether there was something unique about the Midwestern population decline starting in 1970 that suggests changes in US economic policy may have played a role. And this is where the “hollowed out” story starts to fall apart.
US Census data show that of the 504 Midwestern counties that declined in population from 1970 to 2024, 382 also declined from 1950 to 1970. That is, 76 percent of Midwestern counties that exhibited net population loss from 1970 onward were already experiencing population decline before the 1970s.
Of course, a critic may claim that, despite this finding, free-market economic policies implemented in the 1970s could have accelerated the rate of out-migration. To analyze this question, for each county, we divide aggregate population decline by the number of years between 1970–2024 and 1950–1970, respectively, to calculate the average annual rate of population decline pre- and post-potential policy changes. It turns out that 319 out of the 504 counties experienced faster rates of population decline before 1970.
That is, 63 percent of Midwestern counties that suffered population loss post-1970 declined in population at a faster rate before 1970.
These data do not conform to the narrative that free-market policies starting in the 1970s significantly affected population decline in the Midwest. Nor does the Midwest exhibit noticeably different population dynamics in comparison to the rest of the US. In fact, the same analysis conducted on counties outside the Midwest shows remarkably similar results. Of the 455 non-Midwest counties that declined in population post-1970, 73 percent also experienced population decline pre-1970, and 64 percent had a higher average annual rate of decline pre-1970. Those numbers are almost identical to the Midwest, severely weakening the story of a Midwest-specific economic policy shock that led to population declines.
A more granular look at these counties further weakens the story because a great deal of the population decline occurred in rural agricultural areas, such as the Great Plains and the Delta, and mining areas in states such as West Virginia and Kentucky. Many of these declines, related to agriculture and mining, have occurred for more than a century and have nothing to do with the economic policies implemented in the 1970s.
Separately, the data show that population decline has continued in most of these counties since Trump first became president. For instance, 483 Midwest counties had lower populations in 2015 than in 1970. Of these, 331 (69 percent) had an even lower population in 2024. Again, this decline mirrored the trend in non-Midwest counties, where the corresponding number was 287 out of 377 counties (76 percent). This finding is further evidence of inherent county characteristics (throughout the US) and a shift in preferences driving out-migration, not 1970s policy interventions. Given that the Trump administration has centered its economic agenda on the spurious “hollowing out” narrative, it is unsurprising that it has failed to reverse the decline in Midwest population.
The “Emptied Out” Narrative Fails in Other Ways
Another weakness in this hollowed-out Midwest story is that although many of these counties saw a decline in population, the states themselves did not. In other words, some Americans moved to neighboring counties around those shrinking Midwestern cities. For instance, Michigan’s population increased in every decade since 1800, except the 2000–2010 decade. The percentage increases were smaller than the US population percentage increase in the decades following 1970, but the state’s population did not shrink. (In fact, none of the 12 official Midwest states saw a population decline between 1970 and 2024.)
As Brookings scholar John C. Austin explained in 2017, Donald Trump won 75 of 83 Michigan counties in the 2016 presidential election, but “only won the state as a whole by a scant 10,000 votes out of over four million cast.” Moreover, 12 counties in Michigan “that had been reliably blue turned red for Trump in 2016.” Still, of these 12 counties, eight showed population increases between 1970 and 2024. At the very least, these figures run counter to the idea that population declines in those Michigan counties explain Trump’s victory—population increases occurred in two-thirds of those counties.
Overall, these figures are consistent with a more complicated story than one in which the Midwest emptied out, much less one in which it did so due to a shift in economic policy during the 1970s. It appears, instead, that many areas, even within so-called Rust Belt states, grew and prospered. As Austin has pointed out, “the Rust Belt is neither an economic nor a cultural monolith,” and several of the Rust Belt’s larger metro areas have “successfully shed their single-industry monikers and realities.”
Making the story even more complicated is that much of the manufacturing decline in the Rust Belt states was offset by growth in the South. Moreover, this reversal occurred while exports (and imports) were increasing, GDP was rising, income was growing, and the overall reliance on manufacturing jobs was declining.
Conclusion
Based on the idea that 1970s-era free market policies, such as free trade and open immigration, decimated US manufacturing and “emptied out the Midwest,” the Trump administration promised that its restrictive policies would create an economic boom. Aside from the fact that fewer Americans are now working in manufacturing than at any point since the end of the COVID-19 pandemic, there are many reasons to question the administration’s narrative. For starters, evidence shows that even though the population declined in many Midwest counties after the 1970s, it typically declined at a faster rate prior to the 1970s.
Moreover, the population migration patterns of the Midwest closely match patterns of other counties over the same period that are not in the Midwest. In fact, these declining population trends continued in both Midwest and non-Midwest counties after Trump first became president. Additionally, while many of these counties saw population declines, the states themselves did not. That is, many Americans moved to neighboring counties near those shrinking Midwestern cities. Michigan’s population, for example, increased every decade since 1800 with the sole exception of 2000–2010.
These findings suggest economic policies implemented in the 1970s had nothing to do with the Midwestern population declines that occurred after the 1970s. Rather, these data are consistent with a long-term and large-scale shift in preferences that began long before the 1970s, one that was not unique to the Midwest. It is foolhardy to center public policy around this false narrative, and, unsurprisingly, the administration’s attempts to reverse this trend have not only failed but have also economically hurt Americans.